UCSB Beach Chronologic Sequence - April 1972 to January 2020
|
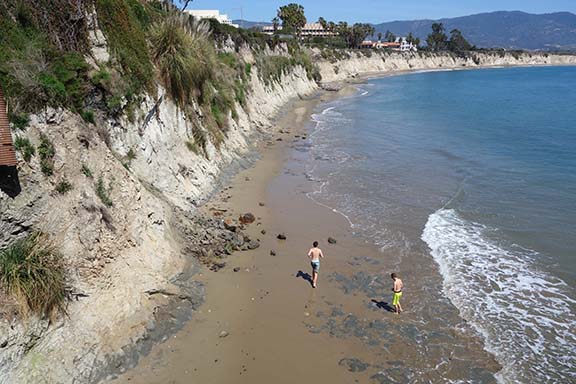
| UCSB Beach, 27 January 2015. 12:22 pm, +1 ft rising tide. Thin veneer of sand has survived wave action during the past three weeks, but 5 ft tides before and after this image washed the base of the cliffs. ©AGS2015. |
 |
| UCSB Beach, 12 February 2015. 12:29 pm, +1 ft rising tide. Bedrock platform has been exposed over the past 3 weeks. ©AGS2015 |
 |
||
UCSB Beach, 26 March 2015. 11:06 am, +0.5 ft.rising tide. Sand has covered the bedrock platform previous exposed in February. ©AGS2015.
|
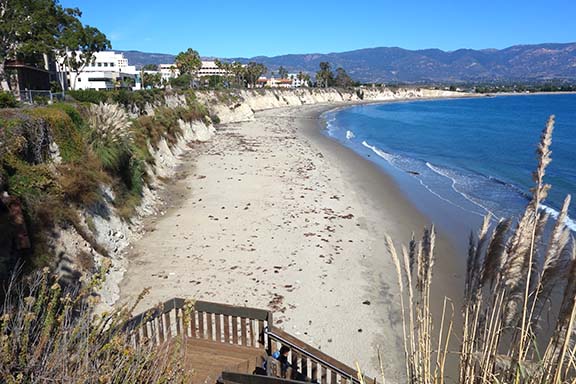 |
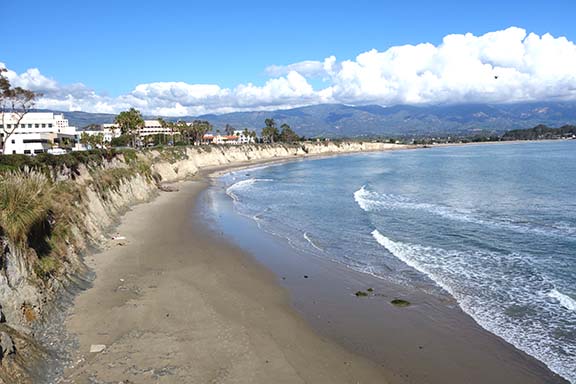
| UCSB Beach, 5 November 2015. 12:00 pm, +2 ft low tide. Sand has returned to the beach, thus buffering the cliffs from wave erosion. ©AGS2015 |
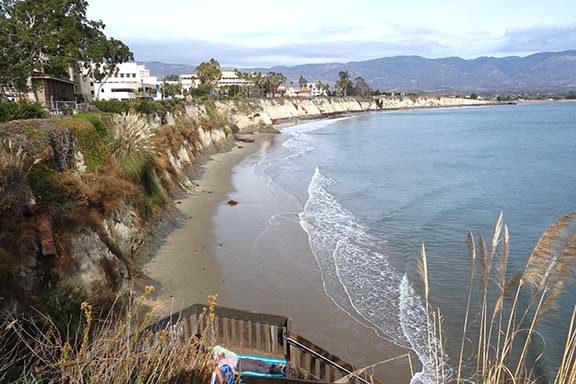 |
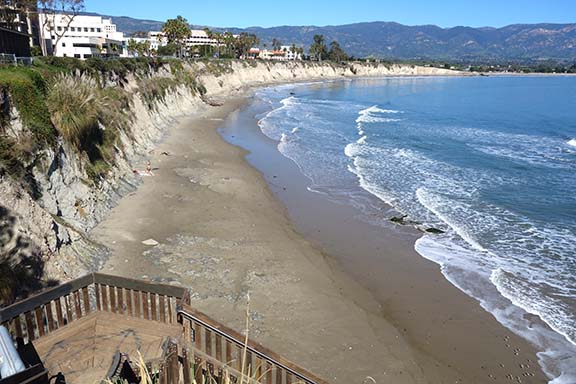
| UCSB Beach, 10 December 2015. 12:11 pm, +1 ft tide ebbing to 0 ft at 3:20 pm. +6 ft high tides at 9:09 am washed the base of the cliffs. Compare this low tide image with tomorrow's high tide image.©AGS2015. |
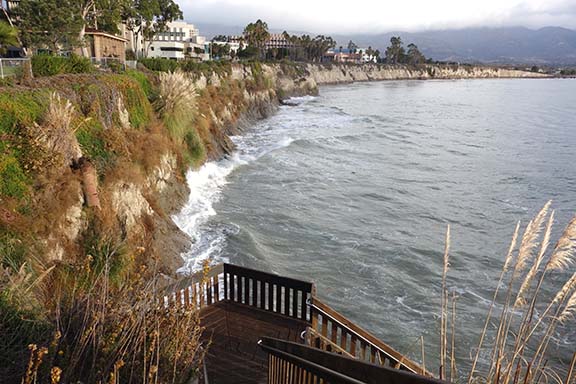 |
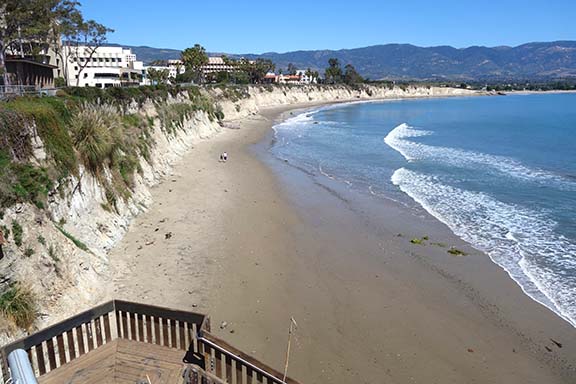
| UCSB Beach, 11 December 2015. 8:09 am, +6 ft tide. Compare this high tide image with yesterday's low tide image. Waves are sloshing nearly 6 ft up the cliff.©AGS2015. |
Return to 2014 | Go to 2016 | Return to Index Page