UCSB Beach Chronological Sequence - April 1972 to January 2020
|
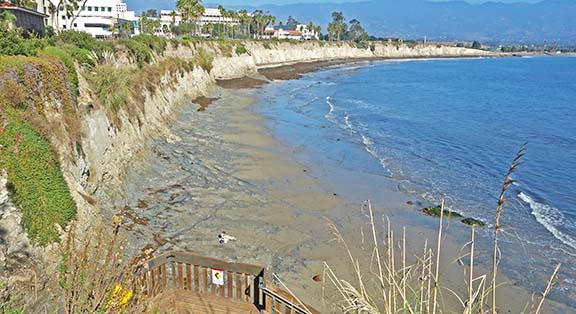
| UCSB Beach, 11January 2018. 11:27 am, +0.8 ft ebb tide before peak low tide of +0.3 ft at 1:02 pm. Bedrock platform is exposed, and a great mass of kelp has accumulated farther up the beach. ©AGS2018. |
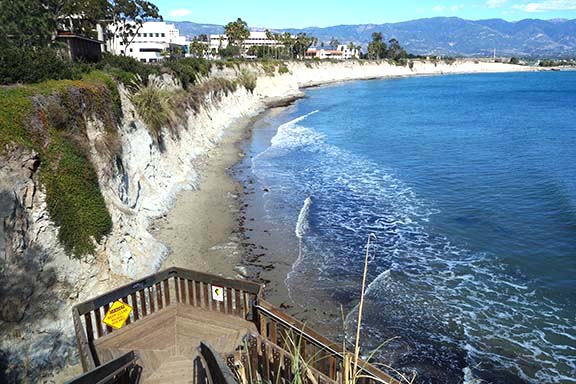 |
| UCSB Beach, 21 February 2018, 12:14 pm, +3 ft high tide. A thin layer of sand covers the bedrock platform. ©AGS2018. |
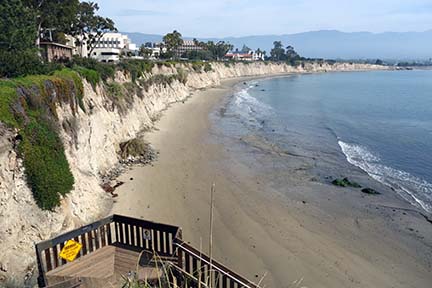 |
| UCSB Beach, 5 April 2018. A narrow strip of sand lies between a flat bedrock surface at the water's edge and the sea cliff. All sand had been removed in January storms. Note the pile of rock and brown vegetation that fell from the cliff. © Arthur G. Sylvester 2018 |
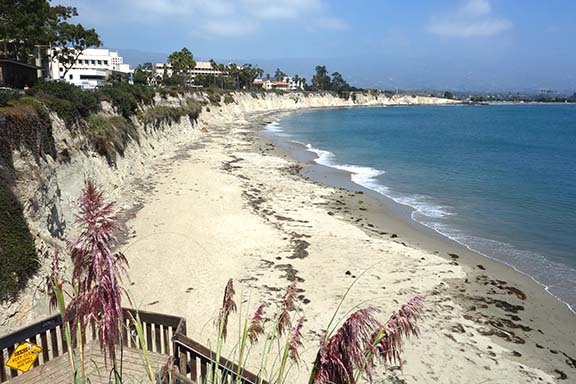 |
| UCSB Beach, 12 September 2018. 12:09 pm, +5.6 ft peak high tide. Summer waves have built a relatively broad beach that has prevented waves from reaching the cliffs. ©AGS2018. |
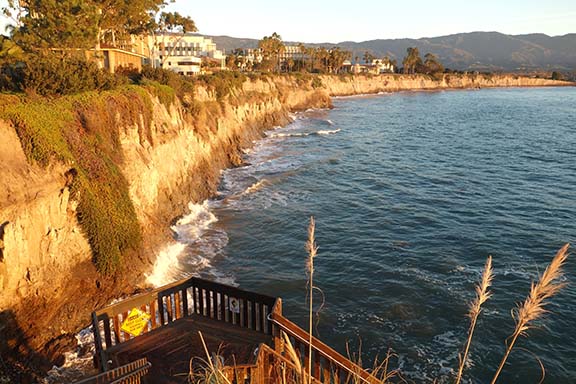 |
| UCSB Beach, 19 December 2018. 7:33 am, +5 ft ebb tide following +5.8 ft peak high tide at 6:34 am PST. Waves have sloshed as much as 6 ft up the seacliffs. ©AGS2018. |
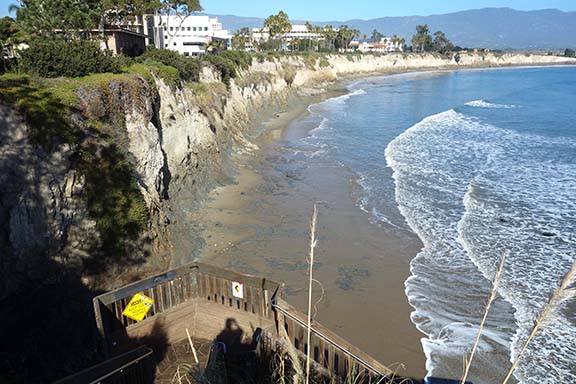 |
| UCSB Beach, 21 December 2018. 12:17 pm, 0 ft ebb tide following +6.5 peak high tide at 7:46 am and preceding a -1.1 ft low tide at 2:59 pm. Bedrock platform exposed. ©AGS2018. |