UCSB Beach Chronological Sequence April 1972 - January 2020
|
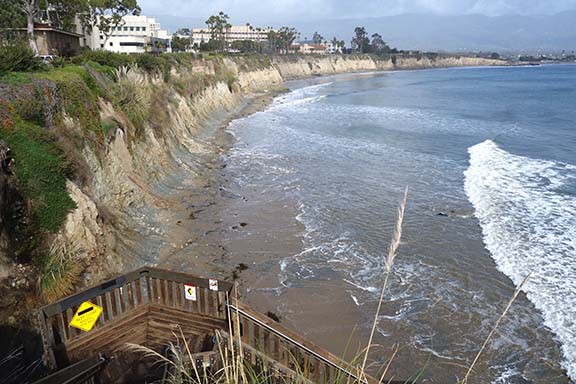
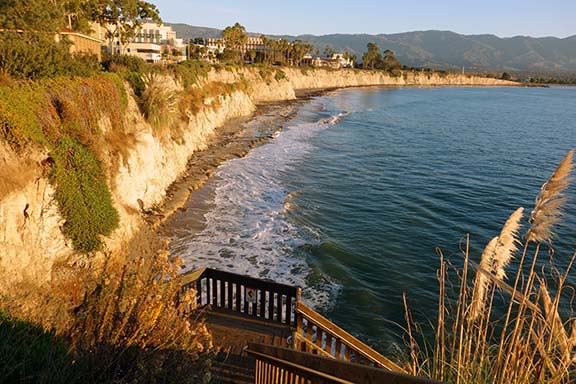
| UCSB Beach, 19 January 2017. 12:01 pm, + 2 ft rising tide. Storm waves on high tides have striped the beach of sand and sloshed as much as 6 ft up the cliff face. ©AGS2017 |
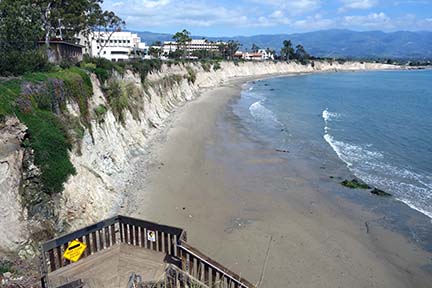 |
| UCSB Beach, 31 March 2017. The beach was striped of sand down to bedrock during the King Tides in the last week of January 2017. A thin veneer of sand has returned in this image, taken at low tide. |
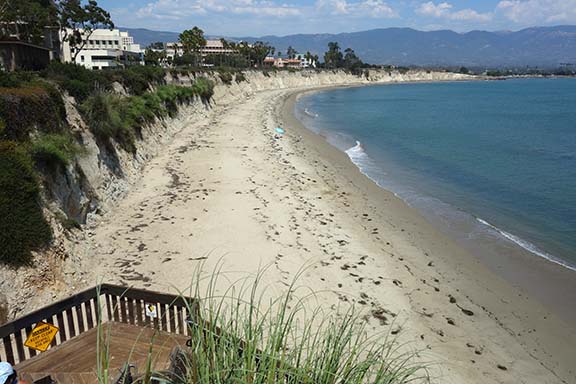 |
| UCSB Beach, 31 August 2017. 12:18 pm, +2.8 ft low tide. Sand has been replenished over the spring and summer months. ©AGS2017 |
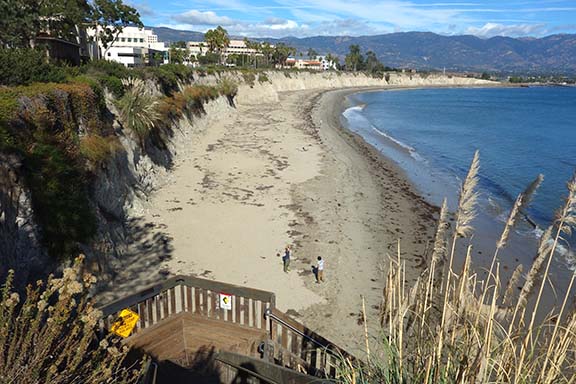 |
| UCSB Beach, 17 November 2017. 12:37 pm, +1 ft ebb tide, following +5.9 ft high tide at 8:17 am. The range between high and low tide, judging by the wetted beach, is relatively small because the waves are small and a low mound of sand has built up during the past 6 months to hold the waves back from reaching farther to the cliffs. ©AGS2017. |
 |
| UCSB Beach, 1 December 2017. 7:30 am, +6 ft peak high tide. A 1 ft high berm prevented earlier high tides from reaching the cliff, but the high tide this morning was overtopping the berm and wearing it down. ©AGS2017. |
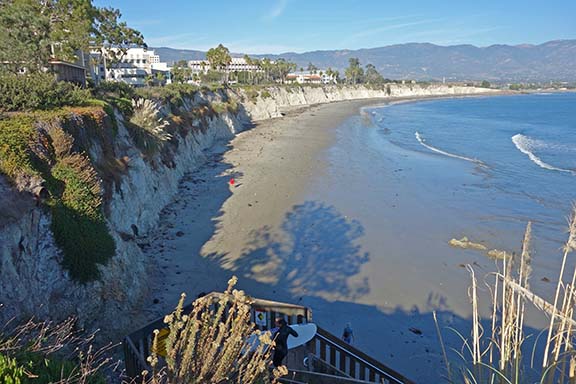 |
| UCSB Beach, 1 December 2017. 2:09 pm, -0.3 ft low tide. Only a tiny bit of the berm remains below the cliff above the red spot in the middle distance. Compare with the 7:30 am image to gauge the tidal range. ©AGS2017. |
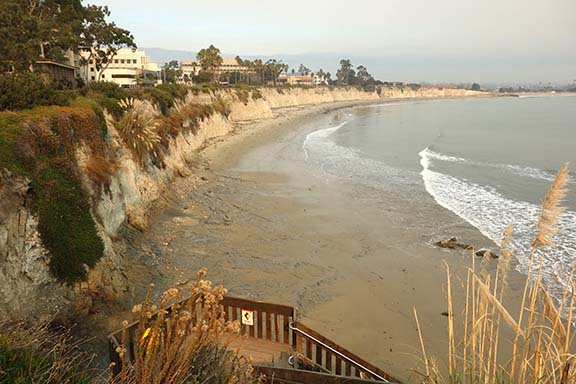 |
| UCSB Beach, 14 December 2017. 12:37 pm, +0.5 ft low tide. Bedrock platform is exposed again in this winter beach. ©AGS2017 |
Return to 2016 | Next 2018 | Return to Index Page